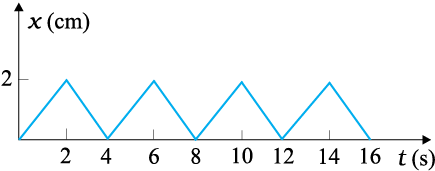
5.24 Figure 5.17 shows the position-time graph of a body of mass 0.04 kg. Suggest a suitable physical context for this motion. What is the time between two consecutive impulses received by the body? What is the magnitude of each impulse?

Fig. 5.17
From the graph, it is clear that the direction of motion is changing after every 2 seconds. And has the same magnitude after 2 seconds.
This can be understood from a situation that a ball collides with a wall elastically in seconds and returns to the original mean position after 4 seconds.
Since the slope of the graph is changing after every 2 s, so impulse is given after 2 sec. of duration.
Velocity can be known by calculating the slope of the position-time curve.

© 2026 GoodEd Technologies Pvt. Ltd.